[Infographic] The State of Mobile Marketing 2016
Deciding on how to allocate your mobile marketing budget for 2016? Let’s take a look at some key statistics to help you decide.
Key statistics for mobile marketing in 2016:
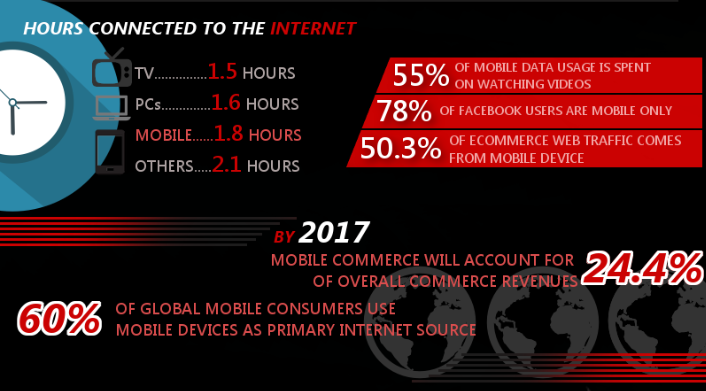
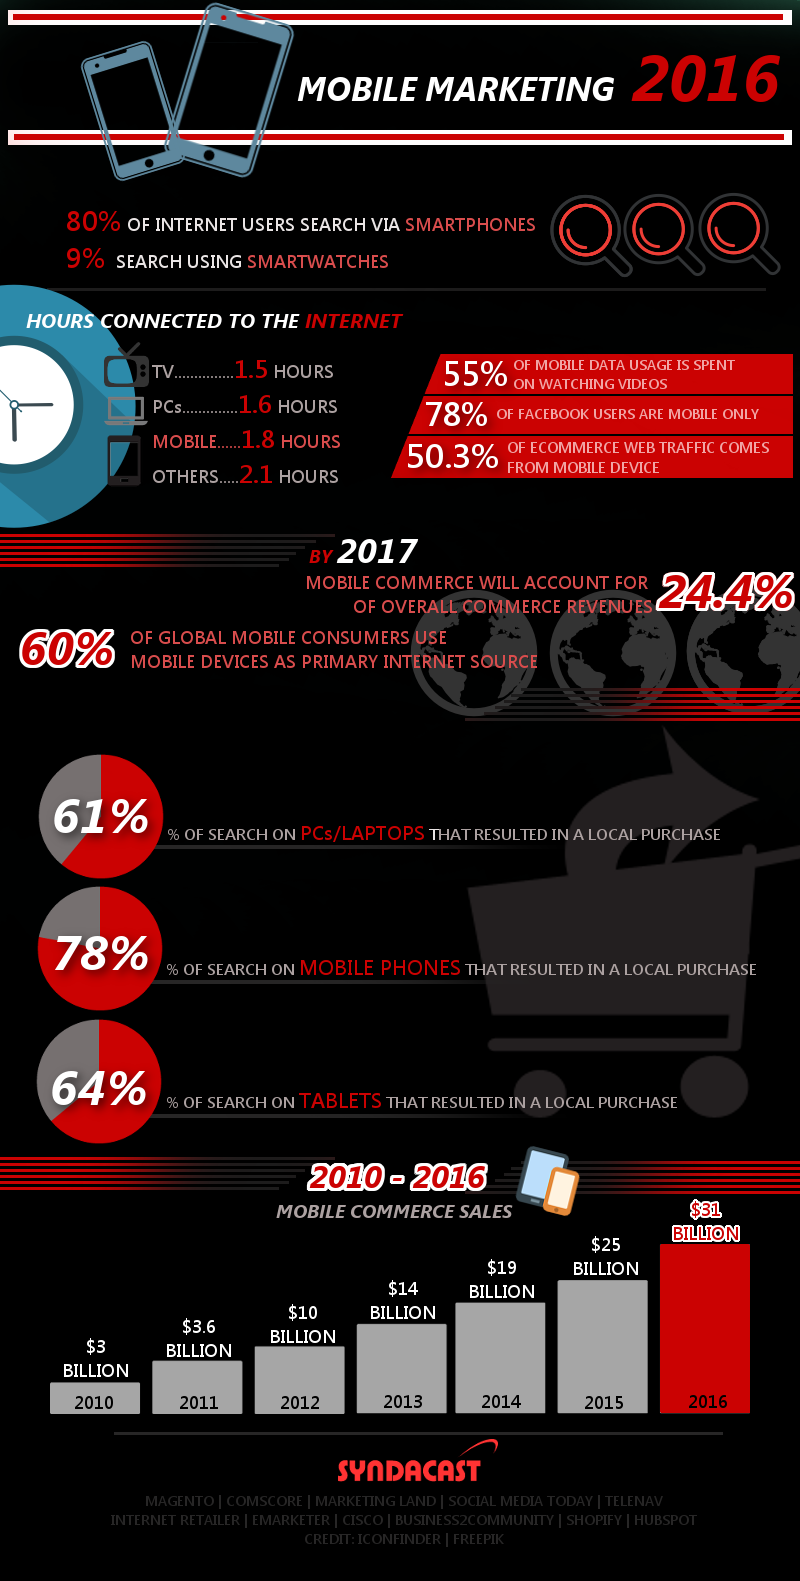
Around 80% of internet users search via their smartphones. While around 9% search via smartwatches. In terms of hours connected to the internet, the average person spends 1.5 hours connected via TV, 1.6 hours, 1.8 and 2.1 hours via PCs, Mobiles and others respectively.
As for mobile behavior: 55% of mobile data usage is spent on watching videos, 78% of Facebook users are mobile only and 50.3% of ecommerce web traffic comes from mobile devices.
It is forecasted that by 2017, mobile commerce will account for 24.4% of overall commercial revenue. Currently, there are around 60% of global mobile consumers who use mobile devices as their primary source of internet.
According to Comscore, 61% of search on PCs and Laptops result in local purchase while the numbers are 78% and 64% for Mobile phones followed by Tablets.
Mobile commerce sales has steadily grown from 2010 to 2016, from $3 billion in 2010 to a forecasted $31 billion by the end of 2016.


